Written by Ophir Gottlieb
PREFACE
With the S&P 500 (INDEXSP:.INX) seeing its first nine-day consecutive losing streak in 36 years, the time has come for us to take inventory of what is going on in the United States, both economically and with respect to the stock market.
Rather than focus on the single big name earnings like Facebook earnings (beat but stock down), Apple (beat, stock rise and then down), Google (beat, stock up and then down), Amazon (miss and stock down) and Netflix (big beat and stock up), we will take a broader look.
ECONOMY
There is a narrative, which somehow has turned political, that the economy is in dire straits. The economy is not in dire straits. Old narratives that were true in the past are no longer true, and the data is incontrovertible.
Let’s start simple and then move deeper. First, here is a chart of real GDP growth:
Real GDP Growth
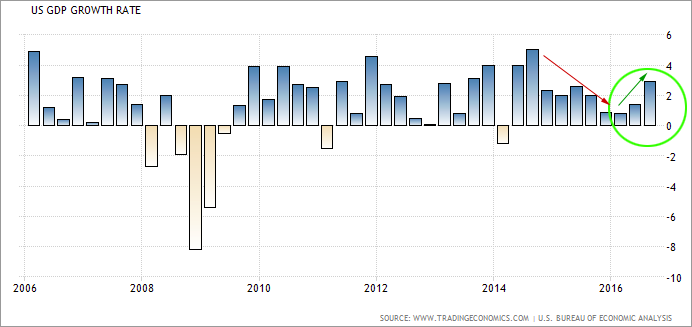
The old narrative, which was true, was that GDP growth had slowed to a crawl and very well may have been on its way to shrinkage. Back-to-back quarters of GDP shrinkage is officially called a recession. While the market got tenuous, it turns out that the tide has turned decidedly upward.
The United States economy expanded an annualized 2.9 percent in the third quarter of 2016, more than 1.4 percent in the previous period and beating market expectations of a 2.5 percent rise, the advance estimate from BEA showed.
It is the strongest growth rate since the third quarter of 2014, as exports grew the most in nearly three years boosted by soybeans and inventories recovered while personal consumption slowed.
Next, let’s turn to real average wages.
Real Wages
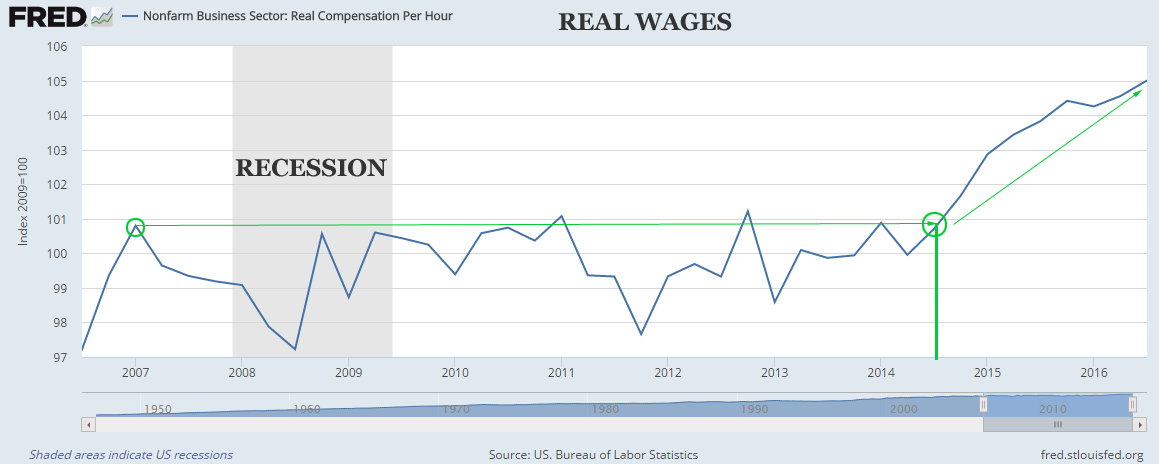
The old narrative, which was true, was that even though the country was in an economic recovery since the middle of 2009, five years into the recovery, real wages were still lower than they were in 2007. That was a legitimate gripe with the recovery and certainly made for uneasy footing when trying to make an argument that “things are better.”
But, we can see a rather abrupt swing upward since 2014 in real wages, moving not only higher than levels seen in 2007, but reaching new all-time highs in real wages for the United States, ever. Again, these are “real,” which is a fancy way of saying adjusted for inflation.
Further, US unemployment rate fell to 4.9 percent in October 2016 from 5 percent in the previous month and in line with market expectations.
We’ll leave a discussion of the economy here and move into the “why” and “when” by examining the 500 largest public companies in the United States as measured by the S&P 500 (INDEXSP:.INX).
THE MARKET
A narrative had formed that growth in the pubic markets had stopped, that earnings were shrinking as was revenue. That was true for a little while, although it was almost entirely due to the energy sector, and more specifically, oil prices. But that narrative is now dead. Let’s start by looking at earnings.
Q3: S&P 500 (INDEXSP:.INX) Earnings
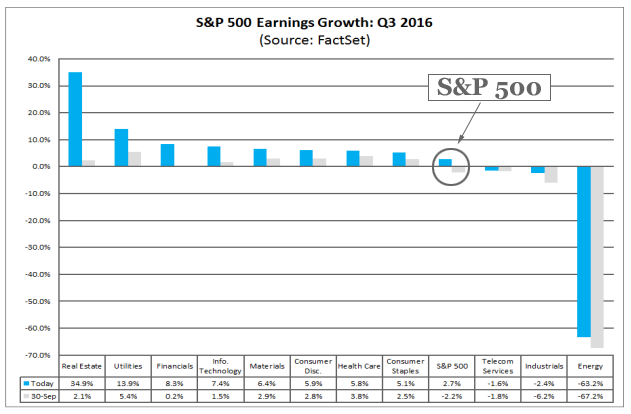
If we look at the circled bars, we can see that there was in fact an estimate for an earnings contraction this quarter – that’s the light gray bar circled. But, so far, the market has outperformed expectations and we actually see earnings growth – that blue bar that is circled.
We can dig deeper and look at the percentage of companies that have beat, met or missed earnings expectations.
Q3: S&P 500 (INDEXSP:.INX) Earnings vs Expectations
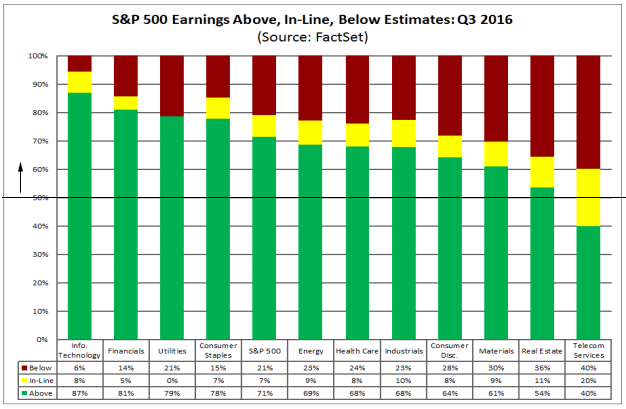
We have drawn in that thin black line on the chart to show the 50% line. The green color represents the companies that have exceeded earnings expectations, while the yellow represents companies meeting expectations and red represents those that missed expectations.
We can see rather clearly that earnings have been better than anticipated, and that’s why in our first chart in this series, that blue bar (actual earnings) was positive while the gray bar (expectations) was negative.
The blended earnings growth rate for Q3 2016 of 2.7% is above the estimated decline of -2.2% at the end of the third quarter (September 30). All eleven sectors have recorded an increase in earnings growth since the end of the quarter due to upside earnings surprises (Factset).
The blended (combines actual results for companies that have reported and estimated results for companies yet to report) earnings growth rate for Q3 2016 is 2.7%. If the index reports growth in earnings for the quarter, it will mark the first time the index has seen year-over-year growth in earnings since Q1 2015 (0.5%) (Factset).
It’s Getting Better
The Earnings growth this quarter has not only been a surprise, but the better news is that guidance is significantly better than anticipated for next quarter. Analysts currently expect earnings and revenue growth to continue in Q4 2016. For the quarter, analysts are projecting earnings growth of 3.9% and revenue growth of 5.0% (Factset).
We can also look at revenue growth. Let’s start with revenue by sector for the S&P 500 in this quarter (Q3).
Q3: S&P 500 Revenue Growth
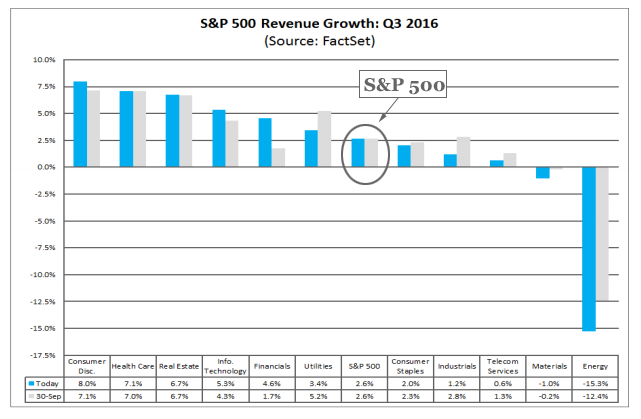
We have circled the S&P 500 (INDEXSP:.INX) to make it easier to see, as the various sectors fill up the rest of the chart. Like with earnings growth, the blue bar (actual) is higher than than the gray bar (projected). Revenue growth has exceeded expectations.
In terms of revenues, 54% of companies have reported actual sales above estimated sales and 46% have reported actual sales below estimated sales. The percentage of companies reporting sales above estimates is above the 1-year average (50%) and equal to the 5-year average (54%). In aggregate, companies are reporting sales that are 0.5% above expectations (Factset).
This surprise percentage is above the 1-year (0.0%) average but below the 5-year (+0.6%) average. The blended revenue growth rate for Q3 2016 is 2.6%. If the index reports growth in sales for the quarter, it will mark the first time the index has seen year-over-year growth in sales since Q4 2014 (2.0%).
If we step out to next quarter (Q4), we see even higher expectations.
Q4: S&P 500 Revenue Growth
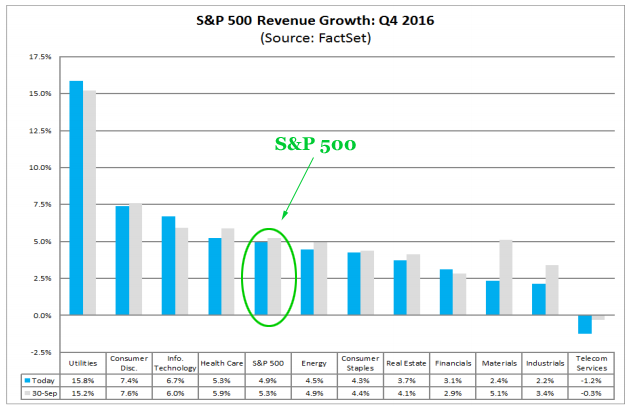
For Q4, we can see that every sector is expected to see growth other than telecom, and the overall average is substantially higher. And finally, we can move to projections for 2017.
Full Year 2017: S&P 500 Revenue Growth
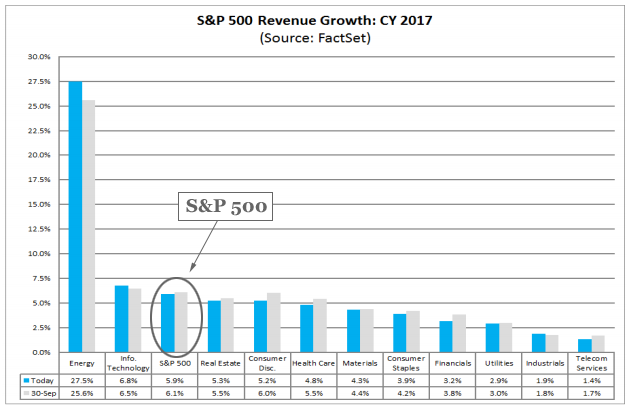
For now, projections have every sector in the S&P 500 showing revenue growth, with the absurd looking recovery for the Energy sector sticking out rather obviously. We have circled the S&P 500 again, for convenience.
So Everything is Great!.. ? Not so fast, actually. While things are certainly looking up from a macro economic point of view and from an earnings and revenue perspective, that doesn’t mean the stock market is ready for another boost higher.
Valuations remain stretched, as they have been for some time. It’s not the end of the world stretched, but I think we’d be hard pressed to say that the market is cheap. Here is a chart of the S&P 500’s valuation as measured by the price to earnings ratio.
S&P 500 Forward P/E
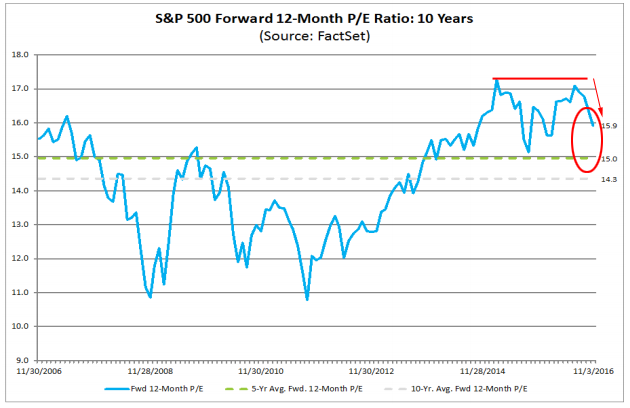
There are a two points we’d like to touch on here:
First, the forward P/E is based on projections for earnings, so if we start to see earnings guidance taken down, that valuation looks even richer (the blue line goes higher).
Second, there does seem to be a sort of “too much” level for the market right now – it has pushed back down every time the forward P/E has risen to the 17 level; it now sits at 15.9 versus a long-term average of 15.0.
While the forward 12-month P/E ratio is 15.9, which is above the 5-year average of 15.0, and above the 10-year average of 14.3, it is below the forward 12-month P/E ratio of 16.8 recorded at the start of the fourth quarter (September 30) (Factset).
The valuation has come down because the market has come down (that’s the ‘P’ in the P/E ratio) and because earnings projections have risen (that’s the 'E’ in the P/E ratio).
This is the counter balance to that solid data we looked at earlier in this dossier.
SO, NOW WHAT?
We will literally copy and paste what we wrote on the first trading day of January of this year:
The market is toppy, valuations are stretched and worldwide monetary policy is not at all aligned. This will likely be a tough year for the broader market, but, another small down year might in fact be exactly what the doctor ordered in order to avoid a massive market decline.
The S&P 500 is up 2% year-to-date, and we called for a range of -3% to +3% in January. That wasn’t a prediction, that was a range where we felt like the market would stay healthy and away from large risk of a bear market tumble. We maintain the view that “right about here,” is exactly what the market needs.
Contrary to what we may read elsewhere, earnings are catching up to prices, and if that continues to be the case, we could see another leg up in this aged bull market.
We do expect another rate increase from the Federal Reserve in the December meeting, which would make two hikes in 2016. That’s nice, healthy and sustainable.
If the market should end up on the year along with real wages at all-time highs, and real GDP growth accelerating while digesting two rate hikes, that bodes very well for a solid economic foundation for our country.
WHY THIS MATTERS
Our research sits side-by-side with Goldman Sachs, Morgan Stanley and the rest on professional terminals. Of our Top Picks, Nvidia is up 110% since we added it. Ambarella is up 90% since we added it. Relypsa was taken over for a 60% gain and we are already up on Twitter when we added it to Top Picks for $15.60.
To become a CML Pro member it’s just $25 a month with no contract. It’s that easy – you cancel at any time, instantly.
Each company in our 'Top Picks’ portfolio is the single winner in an exploding thematic shift like self-driving cars, health care tech, artificial intelligence, Internet of Things, drones, biotech and more. For a limited time we are offering CML Pro at a 75% discount for $25/mo. with a lifetime guaranteed rate. Get the most advanced premium research along with access to visual tools and data that until now has only been made available to the top 1%.