LEDE
At some point, after all the social media craze and pundits on financial television drawing lines on stock charts, we need to stop the noise and just answer, once and for all, has technical trading actually worked in the past?
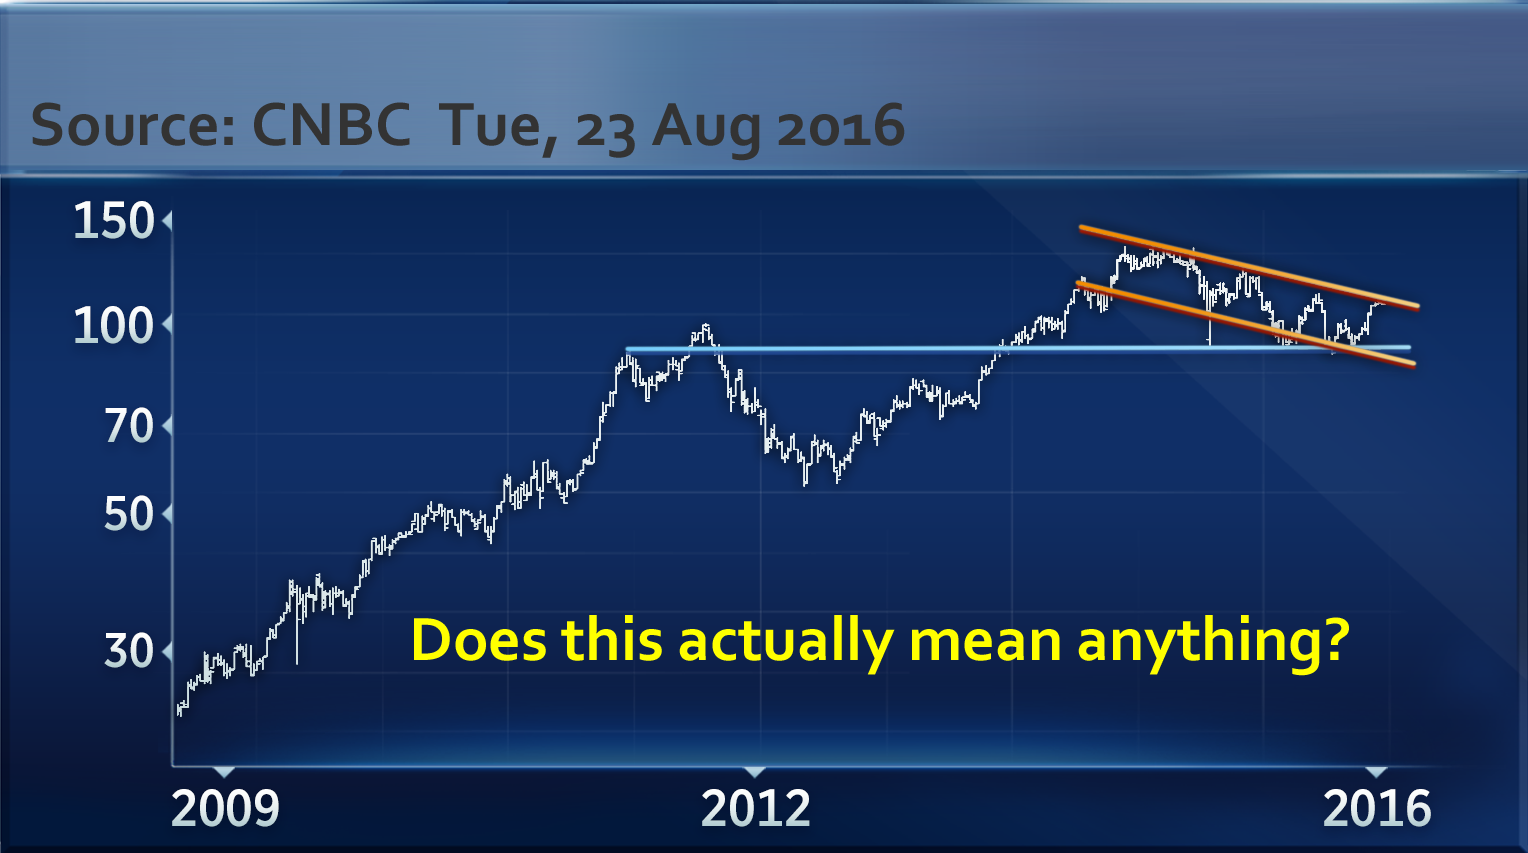
Answers, empirical and explicit, not just some lines on a chart -- that's what we're after.
ANSWERS
The idea is simple -- stocks tend to move in tight ranges for the majority of the time, and then they move in bursts for the remaining periods. The breakout from the TTM Squeeze technical indicator attempts to find these bursts.
Here is a simple graphic, where the gray line is the daily stock price, the blue bars comprise the tight squeeze zone, and then we see the break out into a bearish move. Roughly speaking, this is the pattern that this technical indicator is attempting to identify and back-test.
The goal, of course, is to find these breakouts before they occur and to scan the market for the best historical performers.
Rules
- Open the long 40 delta call (out of the money call) on the day the TTM Squeeze has been broken with upside momentum.
- Close the call after that signal has seen a consecutive two-day reversal.
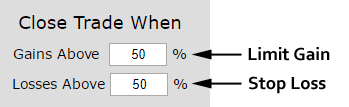
- Use a 50% stop and a 50% limit on the back-test.
- Use the options closest to 15 days from expiration.
- Never trade earnings - irrespective of the technical indicator, this trade will close 2-days before a scheduled earnings announcement.
This is a straight down the middle bullish bet -- this trade wins if the stock rises and will lose if the stock does not.
RISK CONTROL
Since simply owning out of the money options is an aggressive directional bet, we test this approach with added risk limiting parameters, namely, the back-test uses a 50% stop loss and a 50% limit gain.
This also has the benefit of taking profits early, before the bullish signal ends -- that is, before two consecutive reversal days appear.
RESULTS
Owning the 40 delta call in NetEase Inc (NASDAQ:NTES) over the last 3-years but only held it after a TTM Squeeze was triggered we get these results:
The mechanics of the TradeMachine™ are that it uses end of day prices for every back-test entry and exit (every trigger).
We see a 1037% back-test return, which is based on 7 trades in NetEase Inc. A bullish breakout from the TTM Squeeze is a technical signal that doesn't happen often, but rather is designed to mechanically identify the times when a stock is in a low volatility period and may be about to thrust higher.
It's a signal based on probabilities, not absolutes, so it won't work all the time.
Looking at Averages
The overall return was 1037%; but the trade statistics tell us more with average trade results:
- The average return per trade was 82%.
- The average return per winning trade was 106.7%.
- The return for the losing trade was -65.8%.
Technical Details
For the details about the TTM Squeeze, how it works, when it's triggered, why it's relevant and what it means, you can discover scientific option trading from the link (which leads to a short video).
WHAT HAPPENED
This is one way people profit from the option market -- whether it's technical analysis, momentum trading or non-directional option trading. Take a reasonable idea or hypothesis, test it, and apply lessons learned.
Tap Here to See the Tools at Work
Risk Disclosure
You should read the Characteristics and Risks of Standardized Options.
Past performance is not an indication of future results.
Trading futures and options involves the risk of loss. Please consider carefully whether futures or options are appropriate to your financial situation. Only risk capital should be used when trading futures or options. Investors could lose more than their initial investment.
Past results are not necessarily indicative of future results. The risk of loss in trading can be substantial, carefully consider the inherent risks of such an investment in light of your financial condition.
Please note that the executions and other statistics in this article are hypothetical, and do not reflect the impact, if any, of certain market factors such as liquidity and slippage.